

App and network experience monitoring from the customer's side
Puls3 is app and network experience monitoring, measured from where the customer sits rather than from inside the infrastructure. It emulates real user journeys, scores the quality of experience on every test run, and shows where across the footprint a service degrades. It runs above the monitoring you already have and replaces none of it.
The product
What is Puls3?
Puls3 is a network’s quality of experience (QoE) monitoring platform for operators and ISPs. It measures from the end user’s position rather than from inside the infrastructure, using synthetic monitoring: an emulated user runs the journeys real customers run, and Puls3 records what that user experienced.
It exists because a customer blames their provider when a service runs slowly, and the provider is usually not the cause. Every dashboard inside the network says healthy, the streaming service is the one struggling, and the complaint still lands on the operator. Puls3 is how an operator sees that first, and can show where it is. It sits above the fault and performance tools an operator already runs and replaces none of them.
Capabilities
What Puls3 measures,
and what it does with it
Emulation
End user emulation across real journeys
The emulated user streams video, posts to a social platform, loads a page and joins a call: the journeys customers complain about. Tests run on your schedule, five minutes by default, from bots in every region, so a degradation shows where it is. Each records what the journey depends on and ends in a QoE score out of 10, read by category, six of them from video streaming to gaming, or as one overall score.
Scoring
Quality of experience scoring
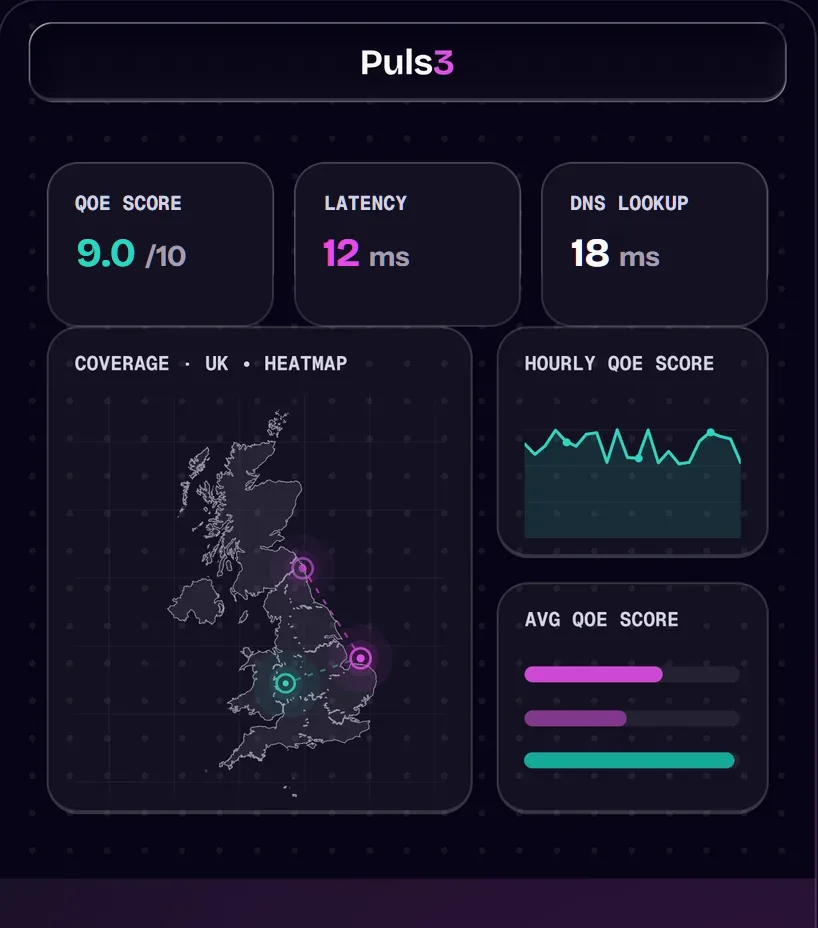
A QoE score says what the journey felt like to the user, not what the link measured. Latency, download and upload speed and DNS response time feed it. The score updates with every test run, on a view you watch rather than a report you wait for, so a drop shows within minutes.
Diagnosis
Hop by hop shows where a service degrades
Every alarm names the bot and the metric: messaging QoE down to 5.98 on one bot, ping up to 62 ms on another. The heat map shows the area, and hop by hop latency between bots shows the link. That turns a support conversation from an apology into an answer, because the network operations centre (NOC) can see where the score fell.
Comparison
Comparing regions shows whether a problem is local or everywhere
Every journey is compared with the same journey elsewhere: other regions, other bots, other times of day. A single measurement cannot tell a bad night from a bad link. Comparison across the operator’s footprint finds the problem that only exists in one place, and the one that exists everywhere at once.
Applications
Application breakdown finds the slow host behind any URL
Enter any URL and choose a bot. Puls3 maps every host the page loads from, its CDNs, its API and its assets, and pings each one from where that bot sits. When a site or an app feels slow, the slow host stands out, so you see what is holding it back from the customer’s side of the network.
Overview
Customer experience index
Outside the NOC, the same measurements read as what customers felt: one score per category, video streaming, social media, messaging, gaming, browsing and productivity, each with the tests behind it and how it moved since yesterday. It is the view for the people who decide: which services hold up, where capacity should go, what can be promised.
What bots run
The tests a bot can run, switched on per bot
There are 15 tests a bot can run from the customer’s end: DNS, ping, speed, social, IPTV, messaging, gaming, video, HTTP performance, page load time, WiFi, productivity, traceroute, hop by hop and VoIP. Every result lands in three places: a column on the bot, a layer on the heat map, an alarm when it crosses its line.
-
DNS and page load time
Every bot resolves names and fetches a real page on its schedule, and times both. Each is a column on every bot, a layer on the heat map and an alarm when it climbs.
-
Social media metrics
YouTube, Instagram, WhatsApp, Telegram, X and Google, tested the way a customer uses them: a social media score per bot and a response time per app, hour by hour.
-
Productivity apps
Outlook, Teams, Azure, GitHub and the Microsoft admin centre, or the apps you choose: a response time per app from every bot over the last 24 hours, against the day before.
-
IPTV monitoring
Live TV over the network, scored as the viewer sees it: a video score per bot with an IPTV performance view beside it, so a channel that buffers is seen in the region it buffers.
-
Gaming QoE score
Latency and loss measured the way a game feels them, turned into a gaming score per bot and per region, with the games customers play in the same view.
-
WiFi analysis
The WiFi test runs on its own interval and reports in its own tab, so the last few metres are measured as well as the network behind them.
Who benefits
Who Puls3
is for
Three kinds of organisation bring different problems to Puls3, and all three run the same two tools: fault management says what is down, performance management says how the network is doing on its own terms. Neither says what the customer experienced, which is when an SLA conversation starts. Puls3 adds that measurement, so a breach is shown on the bots and the hours it affected, not argued over.
-
Puls3 for ISPs
The complaint lands on you whether or not the fault is yours. Puls3 shows what the subscriber experienced and where across the footprint it degraded, so support answers with a fact.
-
Puls3 for network operators
Core metrics can read healthy while customers leave, because the core never sees the customer’s stretch of network. Puls3 measures from that stretch and finds what the core cannot see.
-
Puls3 for application owners
You run a service over networks you do not control. Puls3 runs your journey from bots on them and shows whether the slowness is on all of them or one, before the customer does.
Your stack
Where Puls3 sits in your monitoring stack
Above, not instead of
It runs above the tools you have and replaces none of them
Existing monitoring measures inside out: the state of links, devices and cores. Puls3 measures outside in: the journey as the customer ran it. It runs beside them and adds the experience score, the alarms by bot and metric, and the comparison across the footprint.
- Existing fault and performance monitoring stays exactly as it is.
- Puls3 sits above it, adding the customer’s experience on top.
- No rip and replace, and no new agent on customer devices.
See Puls3 in action
Put your support team ahead of every call
The experience score falls before the complaints rise, so support knows what the caller is about to describe before they describe it. The answer is what happened on that journey, in that region, at that time, not what a healthy dashboard says. Fewer calls arrive at all, because the degradation was seen and fixed first. With Puls3, your team is ahead of every complaint instead of answering it.
Also from Elev8
Elev8’s other platforms
AI data fabric across your systems, and private AI connected to your knowledge base.
-
Learn more , Data fabric and data orchestration
Data fabric and data orchestration
The enterprise integration platform that connects systems and validates data in transit.
-
Learn more , Private AI for your business data
Private AI for your business data
For teams that want AI on their own knowledgebase without handing it to a public assistant. Private, per client RAG inside your own network.
Insights from our team
Notes on measuring what the customer got, not what the link reported.
-
Data governance that survives an audit
What data is held, what for, and who governs it, written down in a form a regulator will accept.
-
AI strategy for regulated industries
Where AI is worth using in a regulated business, where it is not, and how to tell the difference before you spend.
-
Retention policies for training data
How long to keep the data a model was trained on, who decides, and how to delete it without losing the audit trail.



Common questions
Questions about Puls3, answered plainly
What operators ask before running Puls3.
What does Puls3 measure, and from where?
What a customer experiences: streaming video, posting to social media, loading a page, joining a call. Bots in every region run the tests on your schedule and record latency, download and upload speed and DNS response time. Each test ends in a QoE score out of 10, read by category or as one overall score.
How does it know what a customer actually experienced?
Because it runs what the customer runs, from the customer’s side of the network, on a schedule you set. An inside out tool reports the state of a link. Puls3 reports whether the video buffered and how long the page took to load, which is what the customer will describe when they ring.
Can it tell us whether a problem is on our network or in the application?
Yes, from both sides. Every alarm names the bot and the metric, the heat map shows the area, and hop by hop latency between bots shows which link is slow. Application breakdown maps every host behind a URL and pings each one from the bot, so a slow CDN or API stands out from a slow network.
How soon do we hear about degradation?
Within minutes. Tests run on your schedule, five minutes by default, and the score updates with every run. When a result crosses its line, the console raises an alarm naming the bot and the metric, so support usually sees the degradation before the first customer calls.
Which services and applications can it monitor?
The 15 tests a bot can run from the customer’s end: DNS, ping, speed, social, IPTV, messaging, gaming, video, HTTP performance, page load time, WiFi, productivity, traceroute, hop by hop and VoIP. Tests are switched on per bot, and the productivity test runs the apps you choose.
What changes for our support and network operations teams?
The network operations centre (NOC) sees the customer’s experience next to the network’s health, with the alarm naming the bot and the metric, so triage starts from a fact. Support answers a caller with what happened on their journey rather than with a healthy dashboard. The people who decide read the customer experience index: one score per category and how it moved since yesterday.
What does it take to get running on our network?
Bots in the regions you want to measure, and a test profile per bot that sets which tests run and how often. Existing fault and performance monitoring stays exactly as it is, nothing in the network is replaced and no agent goes on customer devices.
How does Elev8 ensure data security and privacy?
All our solutions can be deployed fully offline, or within private or hybrid cloud environments. We never share or process customer data outside authorised boundaries. You decide where your data sits and who can reach it, and that is agreed before anything is deployed.
What deployment options are available for Elev8's products?
Our products are platform agnostic and support multiple deployment models, including on premises servers, private or public cloud, hybrid environments, or even air gapped installations for sensitive clients.
See your network the way your customers do
Tell us which journeys customers complain about most.